
Commercial Solar O&M Cost: 2026 Guide to Cut Opex
Commercial solar O&M cost in 2026 sits at roughly USD 15 to 25 per kW per year for a well-run preventive programme in mature markets, and by NREL benchmarks about USD 19 per kW-DC per year for fixed-tilt commercial PV. That figure is a starting point, not a budget. On a site in Nigeria, Ghana, the Philippines, Kenya or the Caribbean the same scope costs more, because soiling and humidity do more of the work than they do in Germany or California. Getting the O&M number right is a design decision as much as a procurement one.
Quick answer: commercial solar O&M cost
Budget the site, not the market average. A commercial solar O&M cost estimate built from a temperate-climate benchmark understates the cleaning frequency, the thermal inspection count and the corrosion allowance that a tropical or Sahelian site actually needs. The rest of this page is about closing that gap with numbers rather than adjectives.
- Mature-market reference: USD 15 to 25 per kW per year in the United States; GBP 8 to 25 per kWp per year in the United Kingdom, scaling down as system size grows. Treat both as a floor for a commercial solar O&M cost, not as a target.
- Coastal premium: USD 14 to 22 per kW per year on a coastal site against USD 9 to 14 inland for comparable scope, because salt corrodes the grounding and racking hardware three to five years faster.
- What the money protects: an unmonitored commercial array can drift 1 to 2 percentage points of yield per year, and 10 to 25 percent of lifetime output if nothing is caught. That exposure is what the commercial solar O&M cost is actually buying down.
What commercial solar O&M cost actually covers in 2026
A real O&M scope is not cleaning plus a phone number. It is performance monitoring, a scheduled physical and thermal inspection, electrical testing of DC strings and AC protection, inverter health planning, evidence-based cleaning and a defined corrective response window. Strip out monitoring or bill corrective labour separately and the headline number falls, but so does what the site actually gets. Every commercial solar O&M cost comparison should start by checking which of those seven items survived the quote.
| System size | Typical commercial solar O&M cost | What changes at this size |
|---|---|---|
| 30 to 100 kWp | At the top of the range; the visit cost dominates | One visit covers the array; mobilisation is most of the invoice |
| 250 kWp | Mid range; monitoring starts to earn its keep | String-level monitoring becomes affordable and useful |
| 500 kWp to 1 MWp | Lowest per-kW band; scale spreads mobilisation | Inverter end-of-life planning enters the contract |
Two fractions of the same number matter more than the average. Annual O&M typically runs about 1 to 2 percent of installed system cost, and unplanned corrective work costs two to five times more per intervention than the same work scheduled. That ratio, not the per-kW rate, is what a commercial solar O&M cost model should be built around. A low headline rate with a wide corrective exposure moves the real commercial solar O&M cost up, not down, once a fault lands.
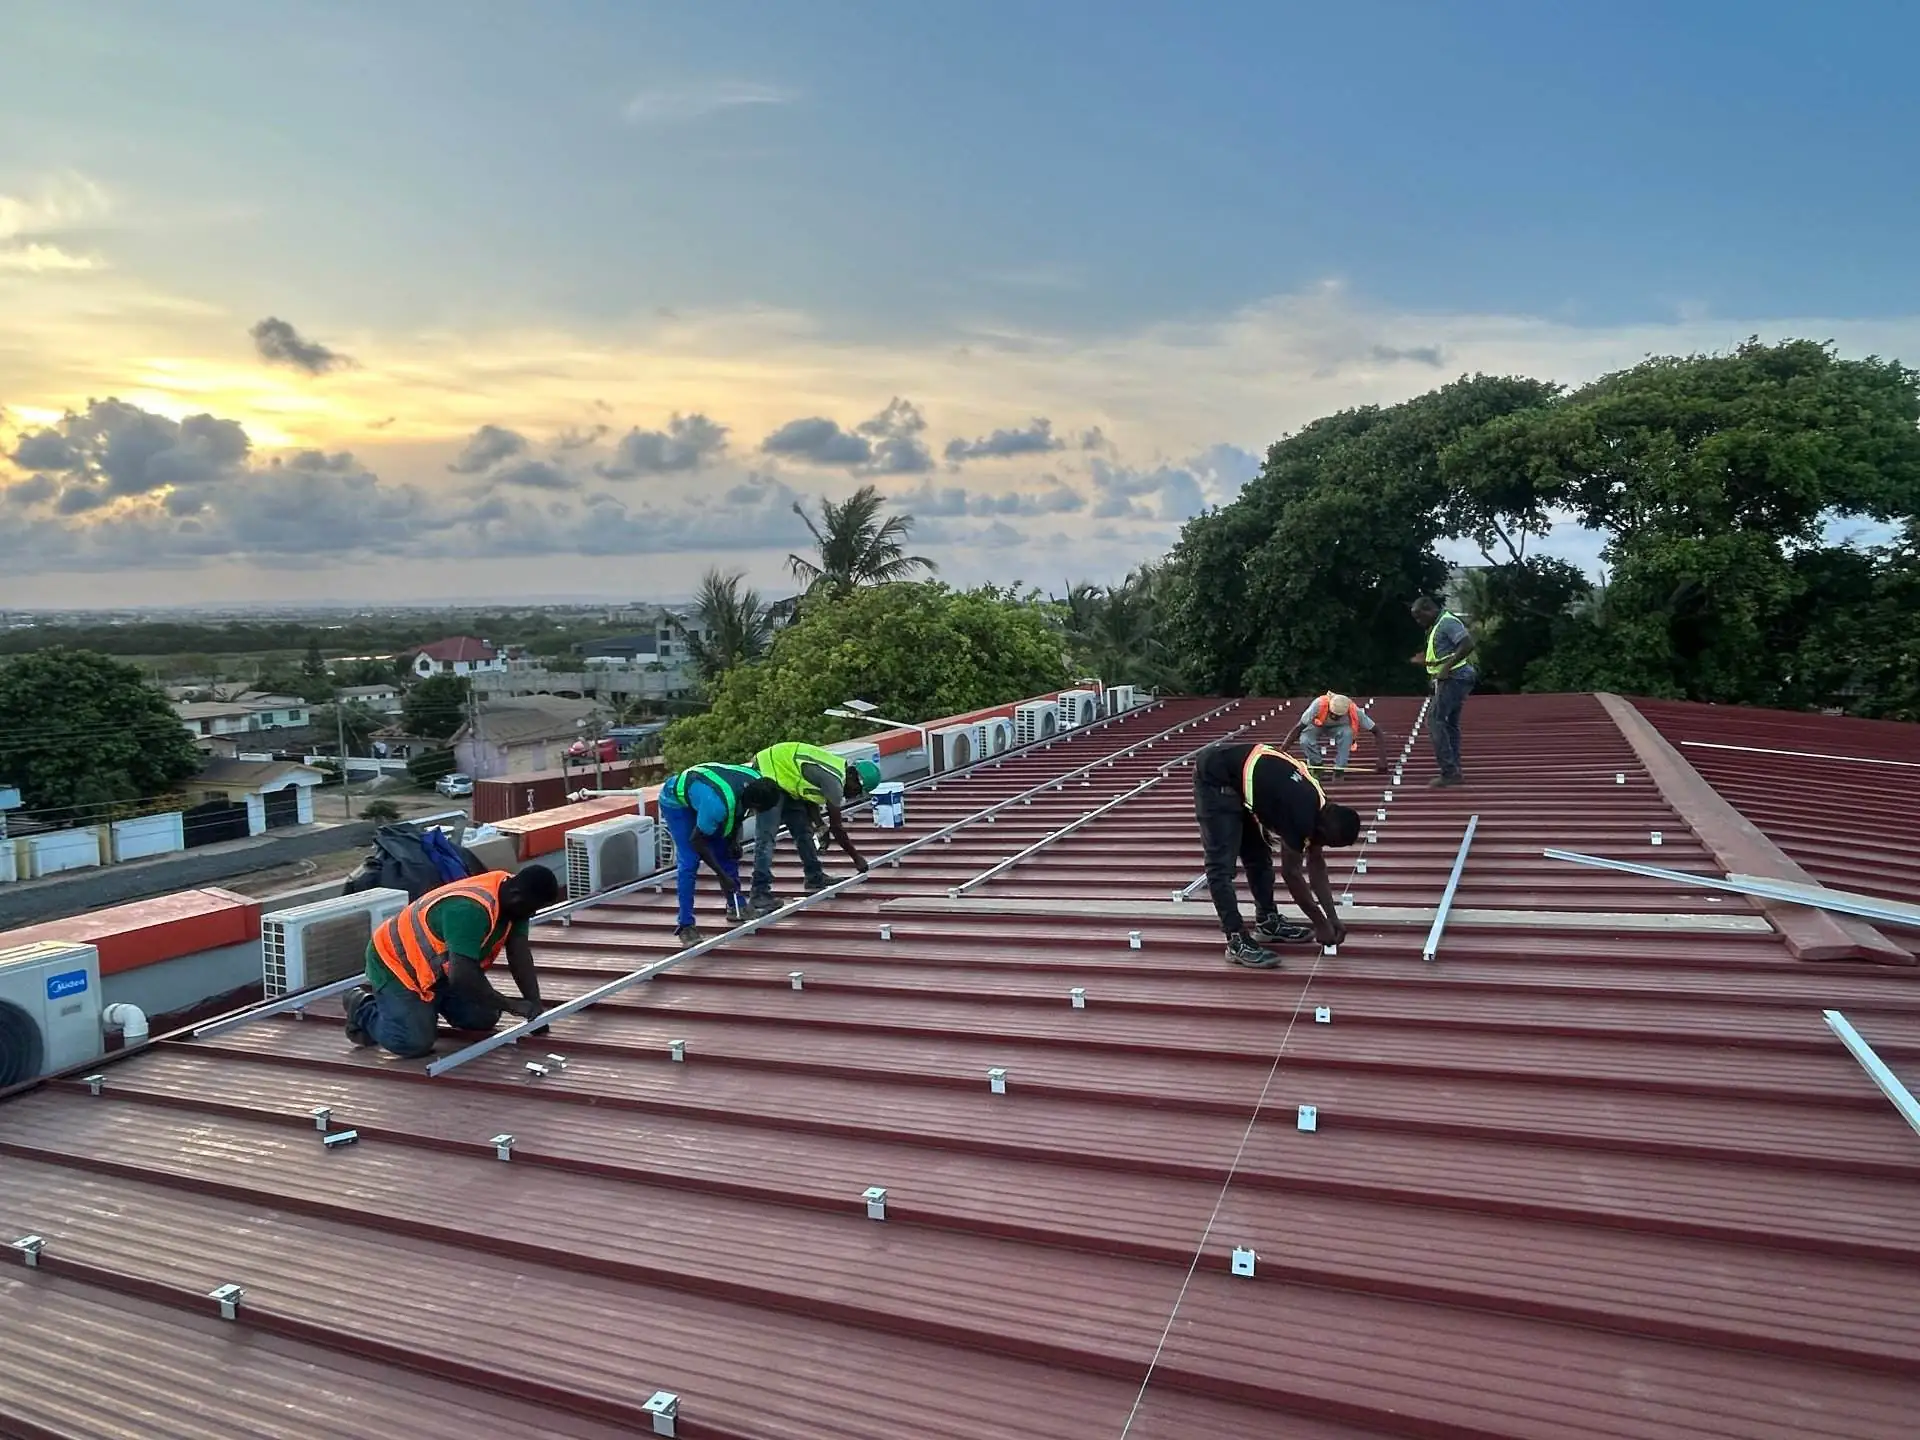
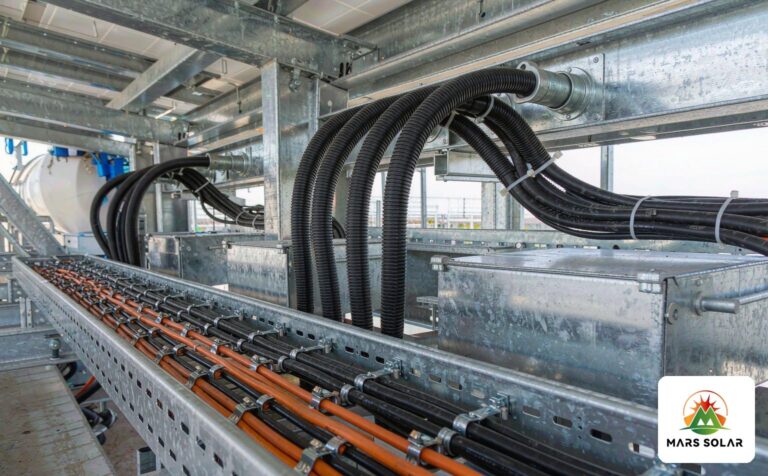
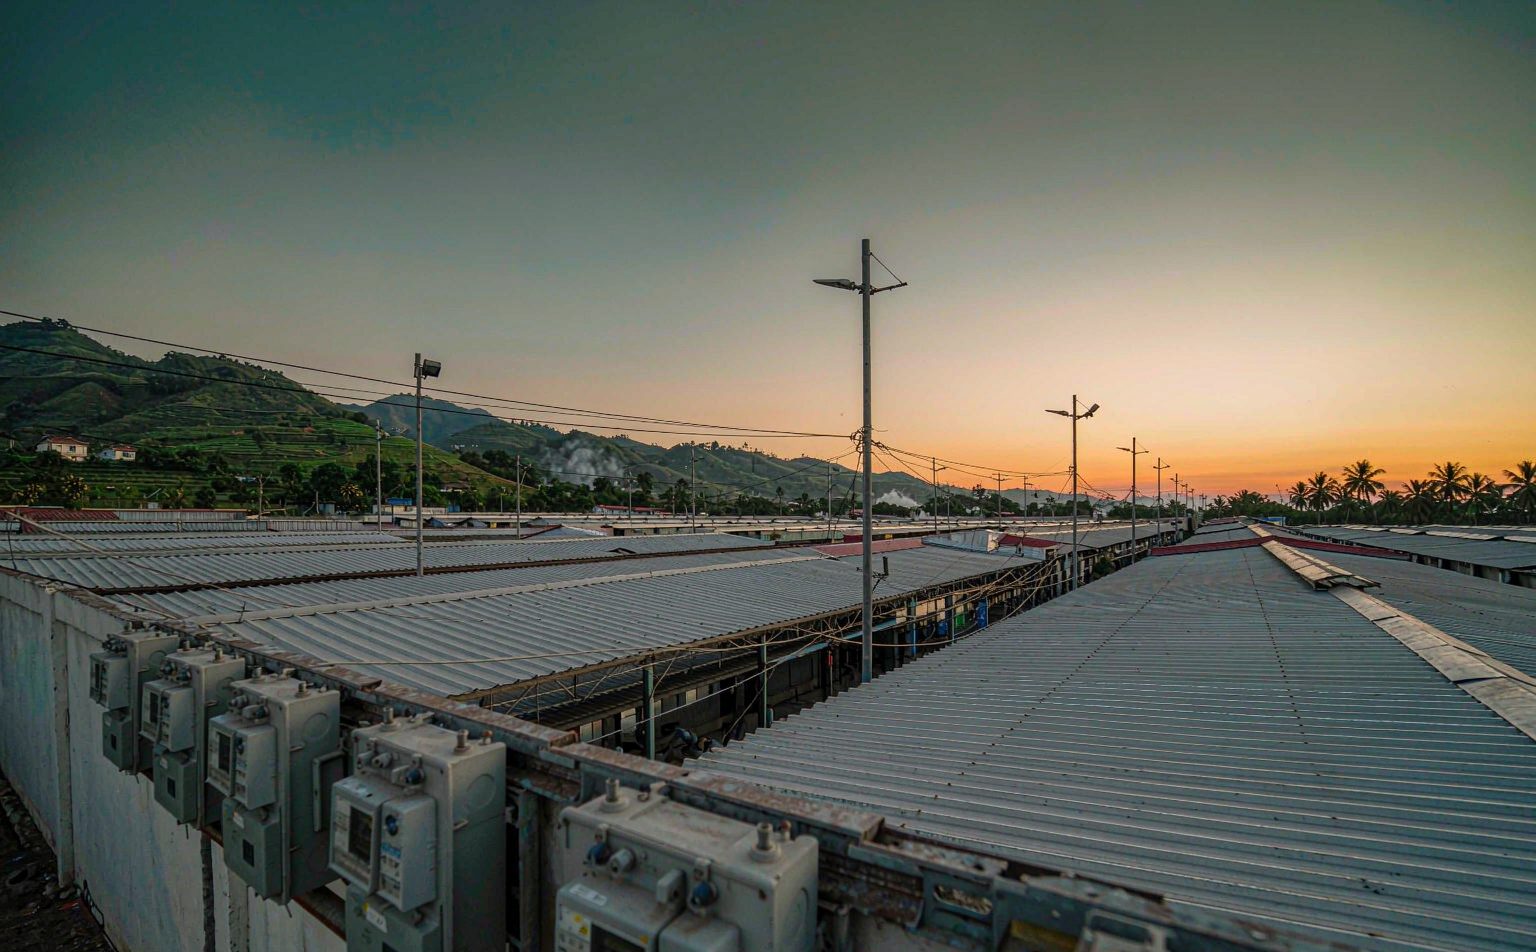
Rails and mounting hardware on a metal roof. Access difficulty is one of the largest silent drivers of a commercial solar O&M cost.
Why a US or UK benchmark does not transfer to tropical and weak-grid markets
The IEA ranks soiling as the second-largest factor affecting PV energy production after irradiance itself. That single sentence explains most of the gap between a published benchmark and a real budget in our markets. A model published in Renewable Energy in 2025, validated against field data with a 6 percent RMSE, found maximum annual soiling losses of about 5 percent in Nigeria and 18 percent in Oman with monthly cleaning, rising to 27 percent in Nigeria and 32 percent in Oman with seasonal cleaning. Cleaning frequency therefore sits at the centre of any commercial solar O&M cost built for these markets.
| Location and climate zone | Annual soiling loss | Effect on commercial solar O&M cost |
|---|---|---|
| Lagos, coastal humid | 2 to 4 percent | Monsoon rain does the cleaning; budget corrosion checks instead |
| Kano, Sahel | 8 to 12 percent | Harmattan season forces extra cleaning visits |
| Nigeria, horizontal, monthly clean | About 5 percent | The lower bound, and only if the schedule is actually met |
| Nigeria, horizontal, seasonal clean | Up to 27 percent | The upper bound, and the usual outcome when nobody owns cleaning |
| Coastal Philippines, salt and dust | Zone dependent, with salt-driven corrosion | Quarterly inspection cadence rather than annual |
The practical warning is in the zone data: applying Lagos soiling figures to a Kano project overstates annual yield by 5 to 8 percent. A commercial solar O&M cost built on the wrong zone is not conservative, it is wrong. Two sites an hour apart can sit in different deposition regimes, which is why we ask for the site coordinates before quoting a cleaning cadence.
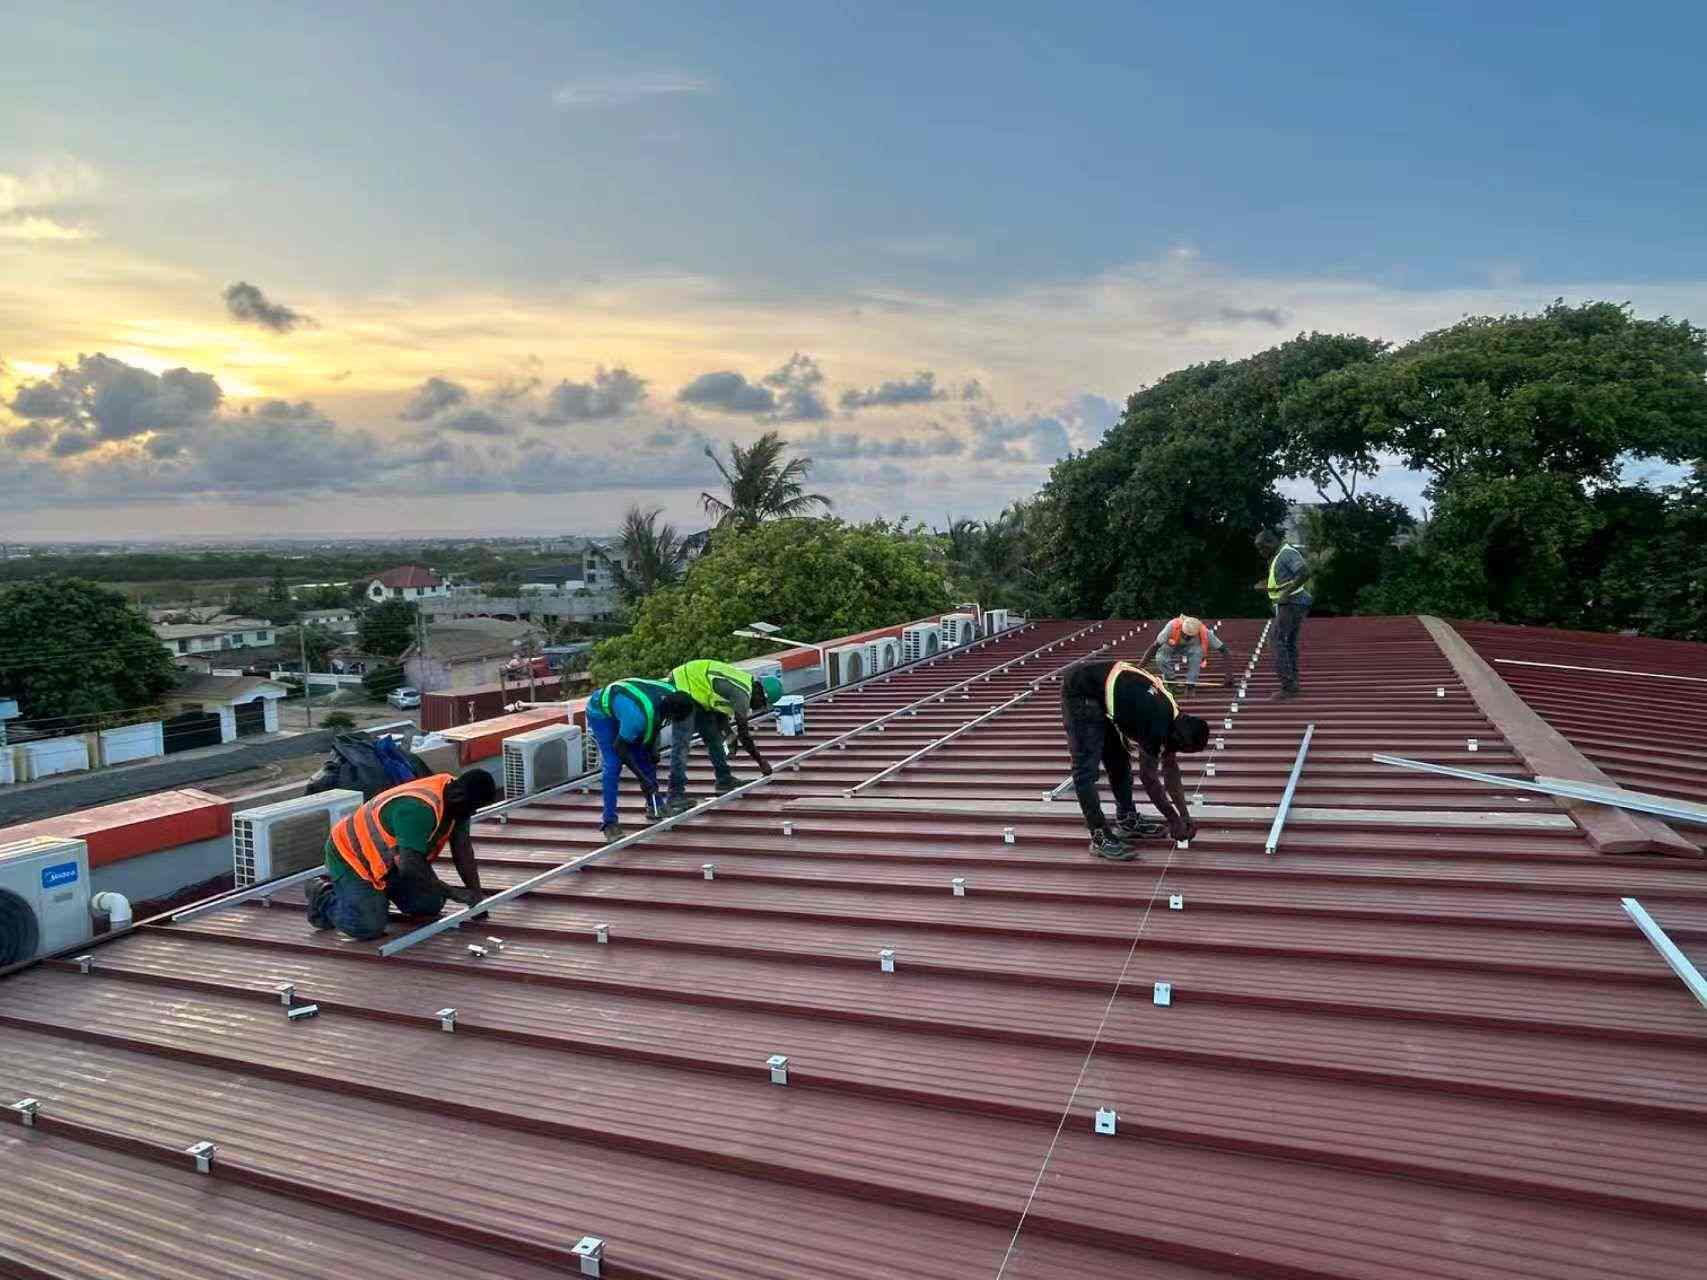
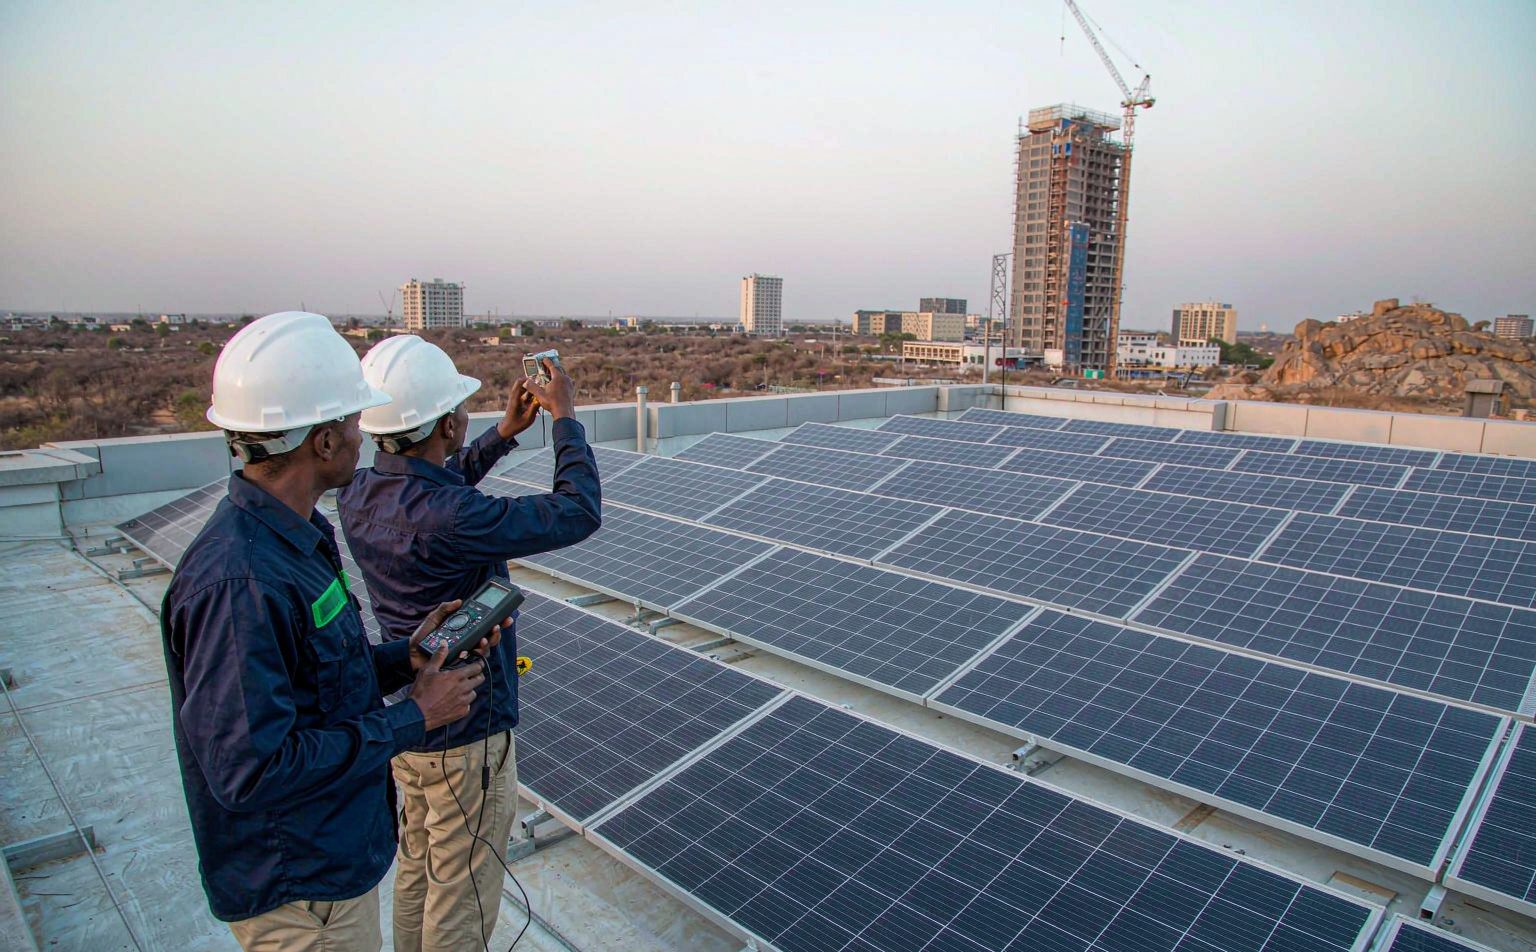
Array detail at installation. What the O&M programme has to keep inspectable for the next 25 years.
Performance ratio: what good looks like, and the 74 percent trigger line
Performance ratio is actual specific yield divided by the theoretical yield for the irradiance received. It is the one number that tells you whether the O&M spend is working, and it is the number lenders care about. A healthy commercial system normally sits at about 80 percent or above in a temperate climate; the useful tropical bands are narrower.
- Sahel zone utility and commercial: 76 to 80 percent after soiling is a realistic target.
- Coastal humid zone: 80 to 83 percent, helped by lower temperature losses but with lower absolute yield.
- Trigger line: an annual PR below about 74 percent is the point at which most AfDB and IFC monitoring frameworks require investigation.
- The headroom: comprehensive O&M has been shown to lift average performance ratio from about 88 percent to 94 percent on well-instrumented systems.
Use PR as the contract's language. A commercial solar O&M cost that is fixed while PR is allowed to drift is a false economy: the site pays the fee and loses the yield, and the loss is invisible without monitoring. Set the PR target, set the measurement method, and tie the review to it. A commercial solar O&M cost with no PR clause is a service fee with no performance content.
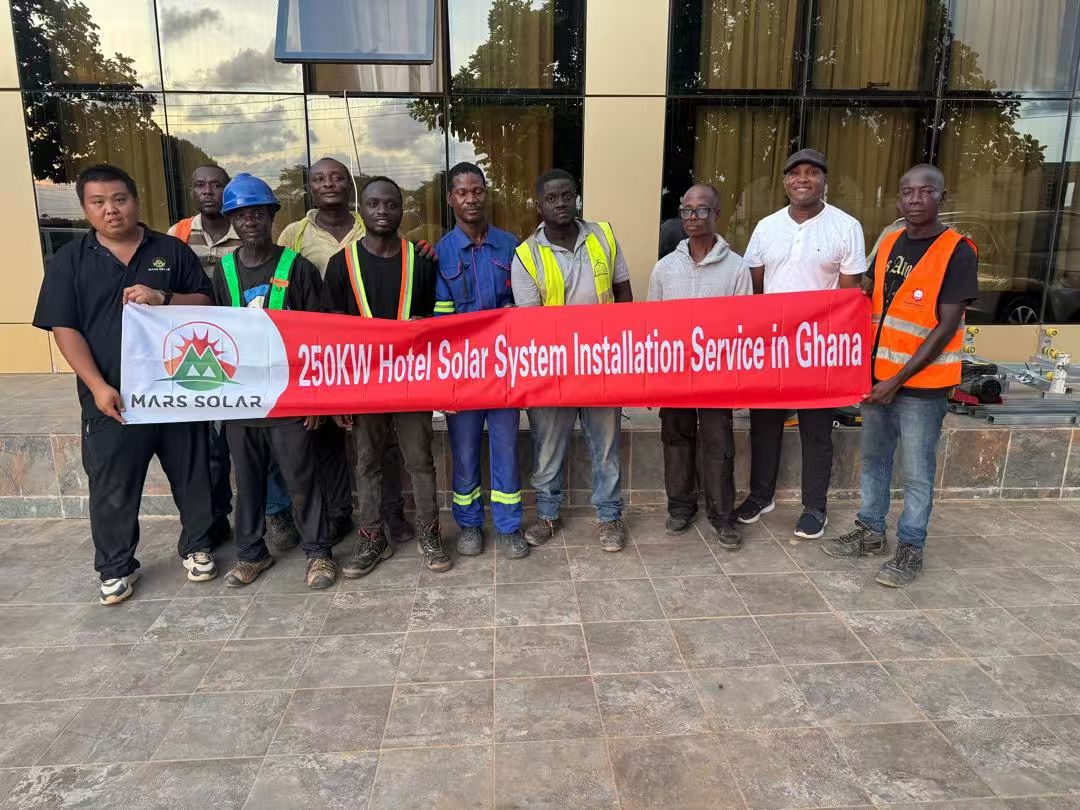
A 250 kW commercial array at completion. This is the size band where a commercial solar O&M cost per kW starts to fall.
What actually drives the number on a 100 kW to 5 MW site
- Roof access. A flat roof with a parapet and a hatch is cheaper than a steep pitch with restricted anchor points, and the difference is visit time, not parts.
- Response window. A four-hour corrective SLA priced into the contract is worth more than a cheaper contract with a next-week promise.
- Monitoring granularity. String-level monitoring costs more upfront and less every year after, because faults are located rather than hunted.
- Environment. Coastal salt and Harmattan dust change cadence, not scope: more visits, more thermal imaging, more torque checks.
- System age. Commercial inverters reach end of life around year 10 to 12; a plan that ignores that puts the replacement capex in the wrong year.
- Spares and local presence. A containerised BESS or a 1 MW array with no local spares inventory converts a small fault into a long outage.
What a proper O&M scope contains
- Performance monitoring at string or inverter level, with named alerts and a named person watching them.
- Annual physical inspection including thermal imaging for hot spots, failed bypass diodes and connector damage.
- Electrical testing of DC strings, AC protection, isolation and earthing to the applicable standard.
- IV curve testing on a defined sample, so degradation is measured rather than assumed.
- Cleaning where the zone justifies it, with a written trigger, not a fixed interval guessed at contract signature.
- Inverter health and end-of-life planning, including whether storage should be added at replacement.
- Documented maintenance log, because several manufacturers exclude damage above defined thresholds unless regular maintenance can be evidenced.
That last item is the one owners underrate. A seven-year-old array without an O&M log is in a weak warranty position the day something fails, and no commercial solar O&M cost saving compensates for a declined claim. The log is the cheapest line item in the whole programme.
Cleaning: when it pays and when it does not
Cleaning is the line item most often overbought in temperate markets and most often skipped in dusty ones. Dust alone can cut yield by anywhere from 5 to 60 percent depending on climate and exposure, and soiling rates on flat modules can reach about 1.3 percent per day during a heavy deposition period. Combined dust and humidity effects have been measured at more than 17 percent efficiency loss within a single month.
In practice, cleaning pays where the local deposition rate is high and the water and access cost is low. In coastal humid zones the monsoon does most of the work for part of the year, so the money is better spent on corrosion inspection. In Sahel zones the Harmattan season sets the calendar, and a cleaning that arrives after the season is a sunk cost. Timing is worth more than technique in a commercial solar O&M cost plan for the Sahel. If you are comparing quotes, ask each vendor to state the trigger they use and the evidence behind it. That single question separates a commercial solar O&M cost built on measurements from one built on habit.
A worked example: 500 kW across three markets
The same 500 kW rooftop, same equipment, three sites. The scope is identical; only the environment and the response window change. The numbers below are indicative planning ranges for a preventive programme, not quotations.
| Artículo | Ghana, coastal | Nigeria, Sahel | Philippines, island |
|---|---|---|---|
| Soiling band | Low to moderate | High in Harmattan | Moderate plus salt |
| Cleaning cadence | Trigger-based, 2 to 3 visits | 4 to 6 visits, season-led | 3 to 4 visits plus rinse |
| Thermal imaging | Annual | Annual plus post-season | Quarterly on coastal sites |
| PR planning target | Banded 78 to 82 percent | Banded 76 to 80 percent | Banded 78 to 82 percent |
| Dominant risk | Corrosion at grounding | Soiling and thermal derate | Salt, storms, logistics |
What the table shows is that the commercial solar O&M cost difference between these sites is driven by cadence and logistics, not by equipment. Budgeting all three at a single per-kW rate is how sites end up under-maintained in one country and over-serviced in another. The commercial solar O&M cost difference between these three cases is cadence and logistics, not equipment. The same logic shapes how a hybrid solar system in Ghana y un commercial solar system in Kenya should be specified against their local tariffs.
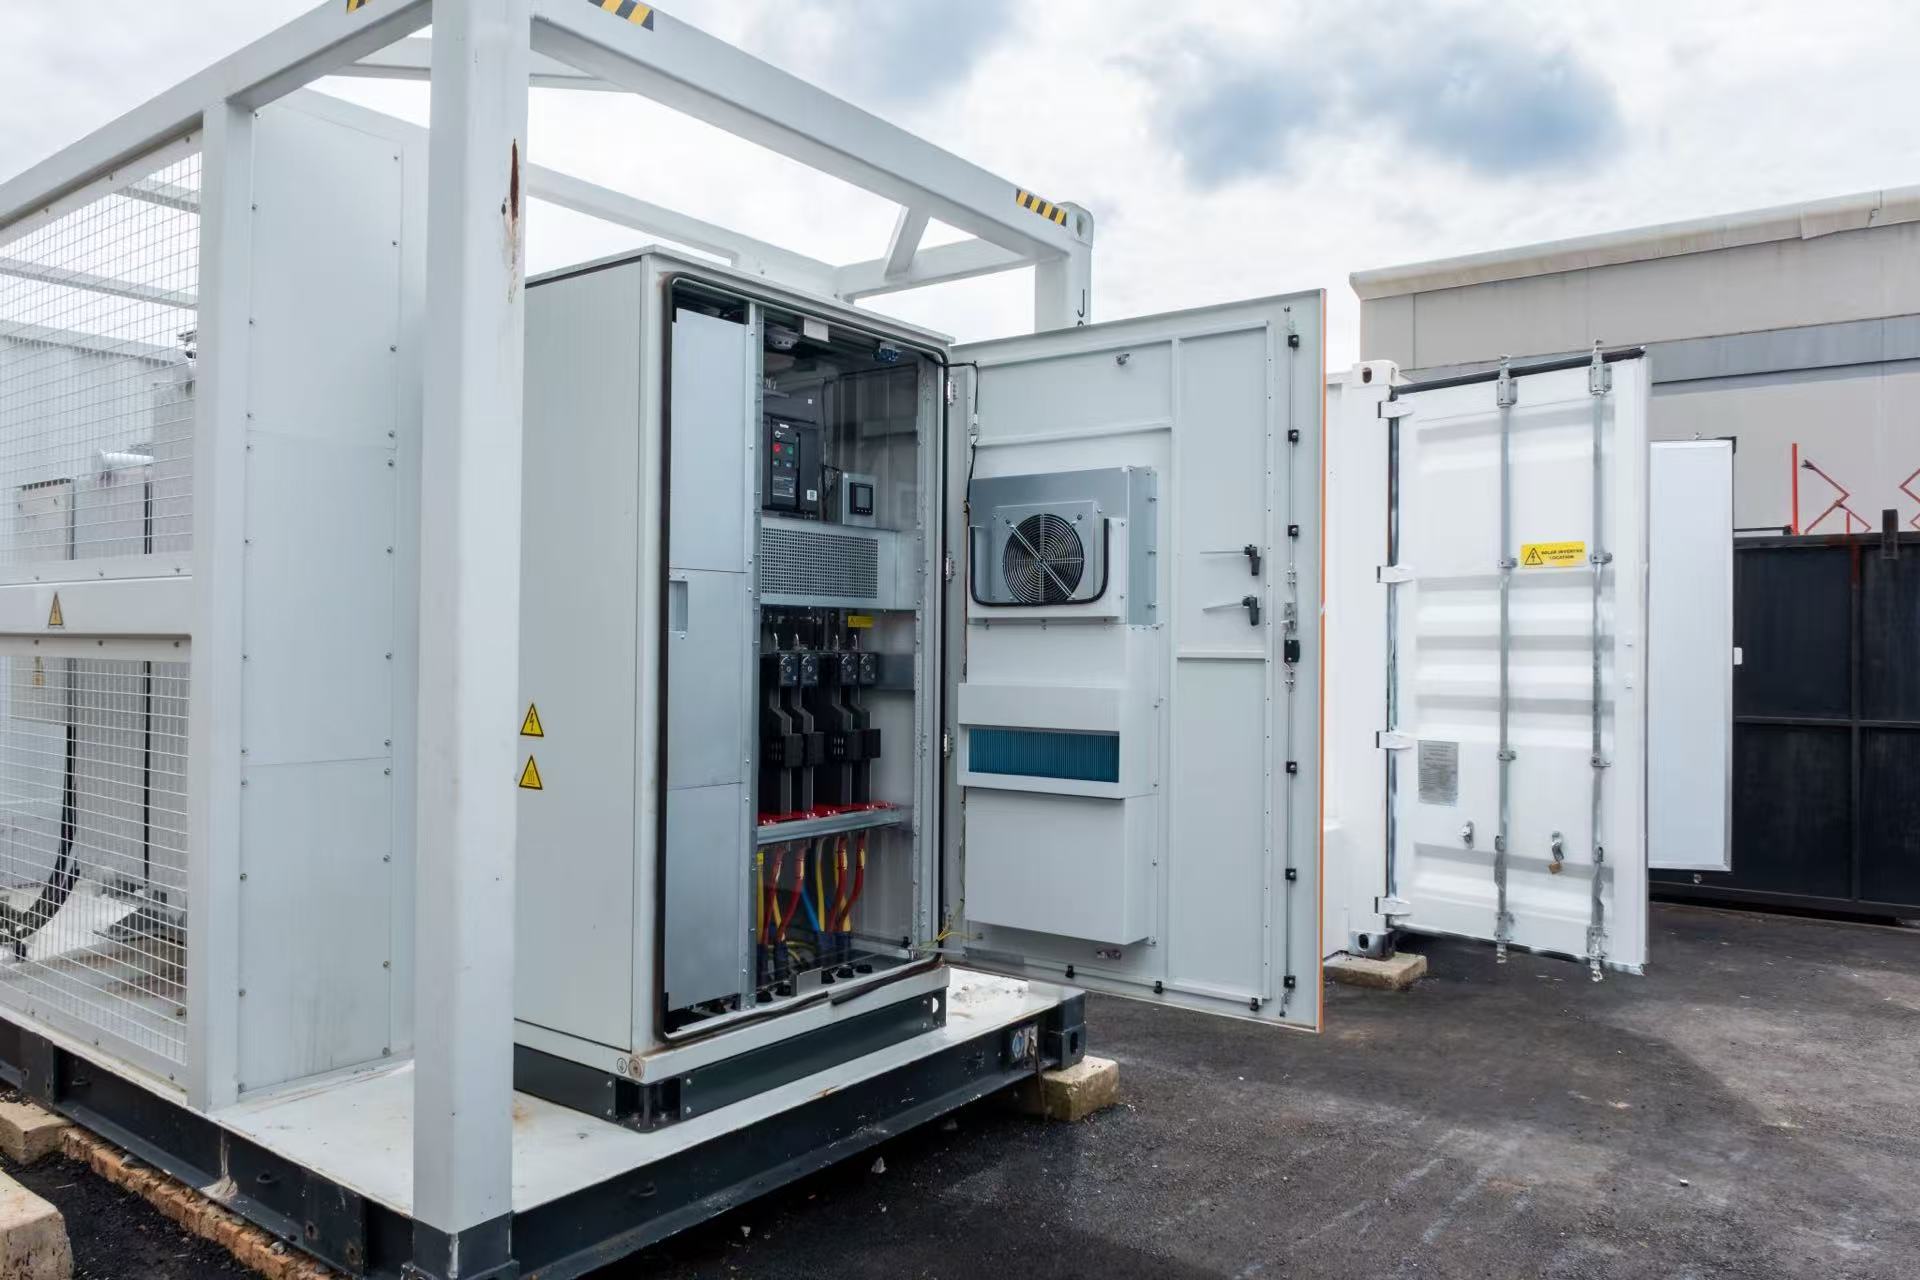
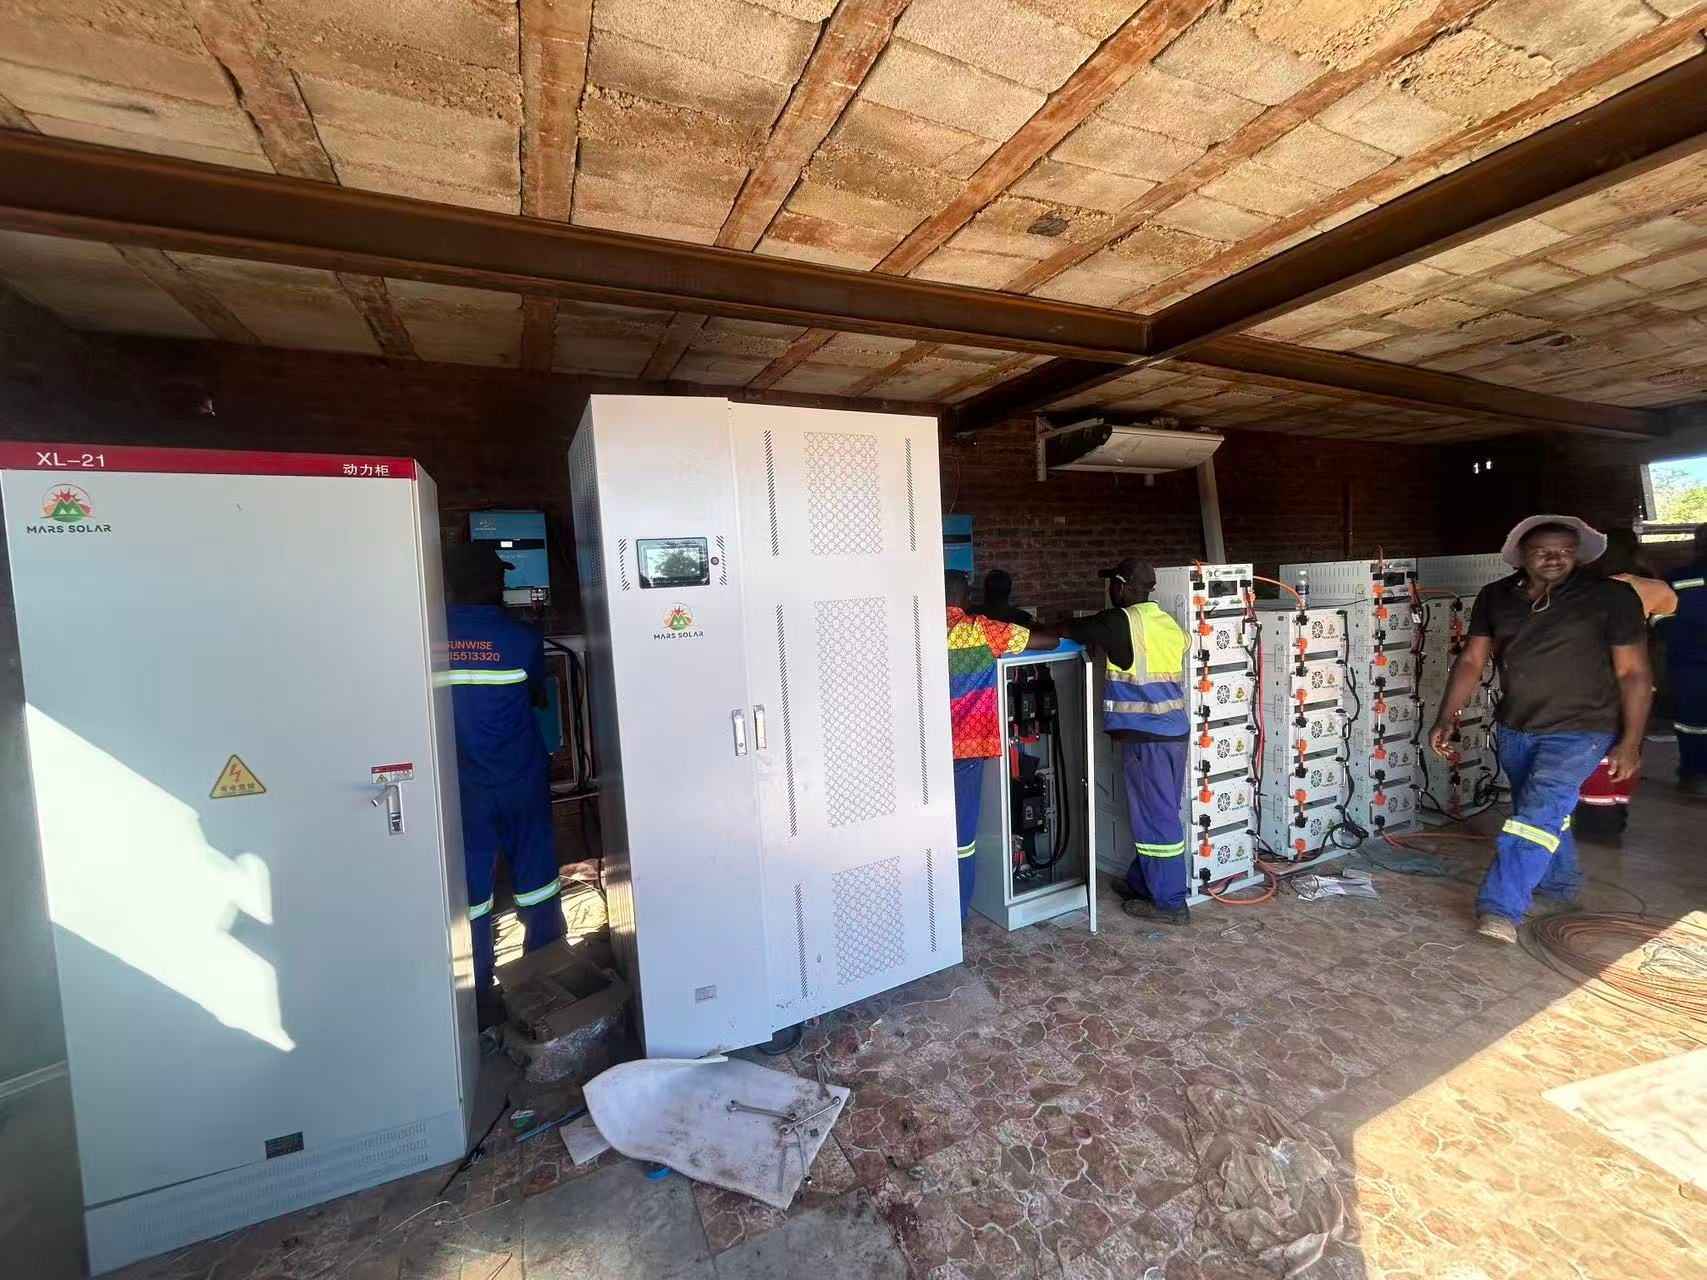
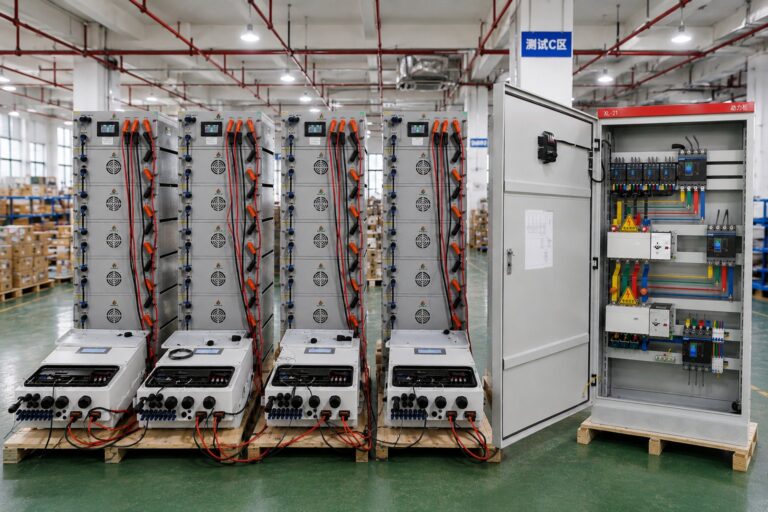
Ground-mount arrays and containerised storage. At this scale the commercial solar O&M cost plan must carry inverter replacement.
How to read a commercial solar O&M cost quote
- Ask for per-kW-year. Flat fees hide the effective rate on small systems and make comparison impossible. It is also the only unit in which a commercial solar O&M cost can be checked against a zone benchmark.
- Check what is excluded. A number below about USD 10 per kW per year on a coastal site is usually missing testing, monitoring or corrective labour.
- Demand the visit count and the scope of each visit in writing, not a description of intent.
- Ask who watches the monitoring, and what happens at 2 a.m. when a string goes dark.
- Ask for the reporting format. Torque checks, test results and a maintenance log are the deliverable, not a courtesy.
Express every quote in the same unit and hold it against the benchmark band for your zone. A fair quote survives that arithmetic; a padded one usually will not, which is exactly why some vendors refuse to give a per-kW number at all. Ask for the number in writing before any site visit, and treat reluctance as information.
Six mistakes that make O&M cost more than it saves
- Buying on price per kW alone. The cheapest contract usually excludes the two items that matter: monitoring and corrective labour.
- Setting a PR target without a measurement method. If the contract does not define the irradiance source and the calculation, the target is unenforceable.
- Cleaning on a fixed calendar instead of a trigger. In a monsoon climate that wastes money; in a Sahel climate it misses the season.
- Ignoring inverter end of life. Year 10 to 12 arrives on schedule, and an unplanned replacement is the largest single line item in the whole budget.
- No spares strategy. On island or inland sites, a two-week part lead time turns a minor fault into a quarter of lost generation.
- No maintenance log. It costs nothing to keep and it is the difference between a warranty claim paid and declined.
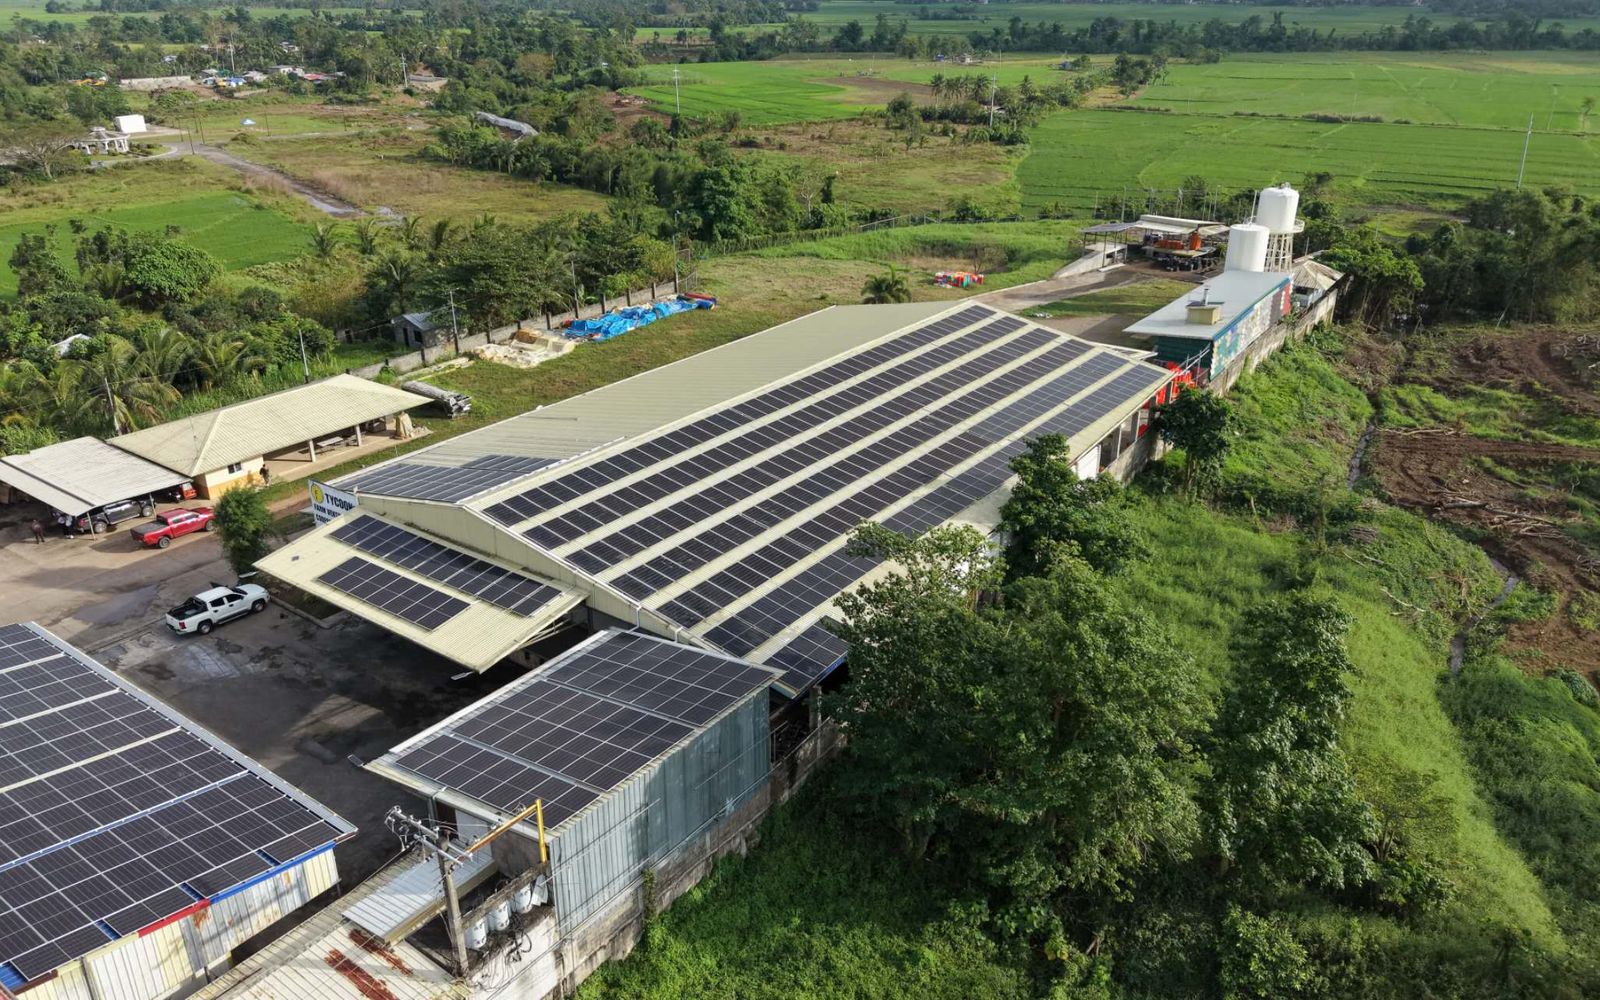
A 300 kW rooftop array on a cold storage facility. Soiling, not equipment, dominates the commercial solar O&M cost on sites like this.
Frequently asked questions: commercial solar O&M cost
What is a normal commercial solar O&M cost per kW per year?
In mature markets the range is roughly USD 15 to 25 per kW per year for a full preventive programme, and about USD 19 per kW-DC per year on NREL benchmarks. Coastal sites sit at the top of that band because salt-driven corrosion forces a tighter inspection cadence. Tropical and Sahelian sites should budget above it, because soiling and humidity add visits rather than parts.
Why is commercial solar O&M cost higher in West Africa than in Europe?
Because the environment does more of the work. The IEA ranks soiling as the second-largest factor affecting PV energy production, and a 2025 modelling study found annual soiling losses in Nigeria ranging from about 5 percent with monthly cleaning to as much as 27 percent with seasonal cleaning. More cleaning visits plus more thermal inspections raise the per-kW figure.
What performance ratio should I write into the contract?
Use a zone-based band rather than a single number: roughly 76 to 80 percent for Sahel sites and 80 to 83 percent for coastal humid sites. Keep an eye on 74 percent annual PR, which is the level at which most development-finance monitoring frameworks require investigation. Define the irradiance source and the calculation method in the same clause.
How often should a commercial array be cleaned?
On a trigger, not a calendar. Flat modules can soil at about 1.3 percent per day during a heavy deposition period, while monsoon rain cleans coastal sites for part of the year. Ask the vendor to state the trigger and the evidence behind it, then review it after the first Harmattan or monsoon season with real data.
Does cleaning really pay for itself?
It depends on the zone. One study measured a 16.6 percent increase in generation after cleaning a rooftop installation, which is far above the cost of the visit. In a coastal humid climate outside the dry season, the same visit may return very little. That is why commercial solar O&M cost should be built around measured deposition, not a fixed interval.
What is included in a proper O&M contract?
String or inverter-level monitoring with named alerts, an annual physical and thermal inspection, DC and AC electrical testing, IV curve testing on a defined sample, trigger-based cleaning, inverter end-of-life planning, a defined corrective response window and a documented maintenance log. Anything less is monitoring plus a phone number.
How much output does a neglected system lose?
A commercial solar O&M cost line is small next to that number. Industry estimates put lifetime loss at 10 to 25 percent, with a drift of 1 to 2 percentage points of yield per year from soiling, string faults and inverter drift. On a 500 kW system that drift is real money every month, and it is invisible without monitoring. Comprehensive O&M has been shown to lift performance ratio from about 88 to 94 percent.
When should I plan inverter replacement?
Commercial inverters typically reach end of life around year 10 to 12. Put the replacement in the plan at commissioning, not when a unit fails, and decide at that point whether storage should be added rather than replaced separately. Inverter replacement is usually the largest single line item a commercial solar O&M cost forecast has to carry, and the year it lands is predictable.
Is a flat annual fee better than a per-kW rate?
Not for comparison. Flat fees can work on very small systems but usually bury a high effective per-kW rate. Ask every vendor to express the price per kW per year, then compare against the band for your zone. A quote that cannot be expressed that way is worth a second look.
Can I expand the array later without redoing the O&M contract?
Usually yes, but the contract should say so. Expansion changes string configuration, monitoring points and often the inverter loading, so the scope and the per-kW rate both need a defined review. Our guide to expanding a solar PV system covers the design side of that decision.
Data sources and freshness
Figures were checked in October 2026. Cost benchmarks are drawn from NREL fixed O&M figures as reported in commercial solar ROI analyses and from published US and UK commercial maintenance benchmarks; soiling figures from a 2025 Renewable Energy study using a coupled opto-thermal-electrical model validated at 6 percent RMSE, and from zone-based West Africa practice data. Performance ratio bands and the 74 percent trigger reference follow AfDB and IFC monitoring practice as reported in project finance guidance. Open irradiance and resource data is available through energydata.info, and programme context through the US Department of Energy solar office.
Reviewed 26 October 2026. Tariffs, soiling rates and warranty terms change; confirm current local data and the equipment warranty conditions before setting a contract price.
Want the number for your own site?
Send us the system size, the location and the roof or ground-mount arrangement. We will come back with the cleaning cadence your zone implies, a performance ratio target you can put in a contract, and the commercial solar O&M cost band for that configuration.
Chatear por WhatsAppRelated reading: grid-forming vs grid-following inverters · hybrid inverter sizing · Guía de certificación solar · choosing a reliable supplier · commercial BESS in the Philippines · off-grid solar in the Philippines · BESS pricing in Nigeria · solar cost in Nigeria · panel prices in the Philippines · panel prices in Ghana · panel prices in Kenya · Contáctanos

 English
 Arabic
 Spanish
 French
 Dutch
 Portuguese